Monitoring Radiotherapy with PET
Proton therapy has the ability to deliver a highly conformal dose to tumors.
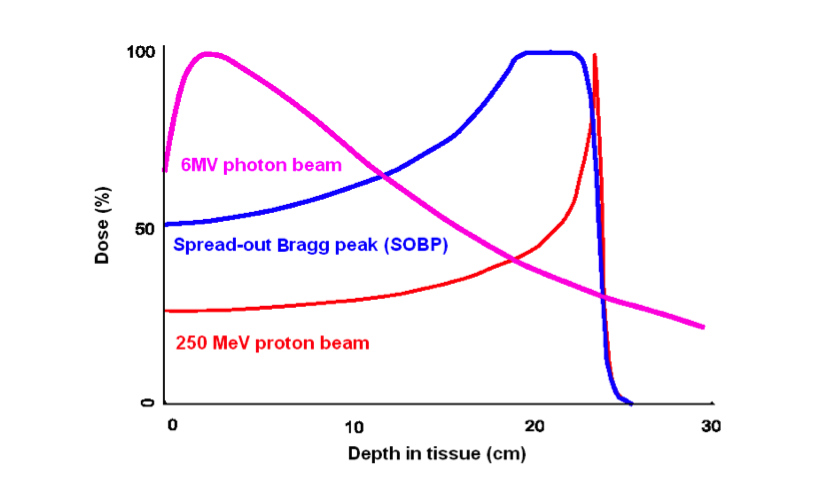
However, localized proton dose deposition at the end of beam (i.e. Bragg peak) comes at the price of significantly greater impact of uncertainties in the treatment plan compared to photon therapy. Range uncertainties may result in under-dosing of the target and/or excess unintended dose to adjacent critical structures.
The goal of this research is to develop novel approaches for adaptive Positron Emission Tomography (PET) monitoring of Proton Beam Therapy using endogenously generated positrons. Verification of the beam delivery within the patient is very important to ensure the proper functioning of treatment planning and delivery systems. A full-ring PET scanner within the treatment room is desirable so that the patient can be imaged on the same bed immediately after irradiation. We are investigating the potential of in-room PET monitoring/verification for proton therapy using a mobile full-ring prototype PET scanner available at MGH, recently upgraded to a mobile NeuroPET/CT (PhotoDiagnostic Systems).
Click here for a short video explaining this project.
Show/Hide Animation
The proton beam from the cyclotron is sent to a patient’s tumor and, as a secondary effect, creates radioactive isotopes that can be imaged:

In-Room PET
In-Room PET
We are investigating an in-room, stand-alone PET (soon PET-CT) system which could potentially provide a cost-effective, high-performance option for PET range verification. Compared to in-beam PET, an in-room PET system involves a significantly lower cost, is more flexible and technically much easier to implement. A full-ring detector geometry can be used which improves both sensitivity (solid angle for data collecting efficiency) and image quality. Compared to off-line PET, instead of transporting and repositioning the patient at a remote site for imaging, with an in-room scanner the acquisition can be initiated very shortly (∼2 min) after irradiation while short-lived nuclides are still abundant, and the overall signal intensity is be significantly higher than in the off-line scenario.
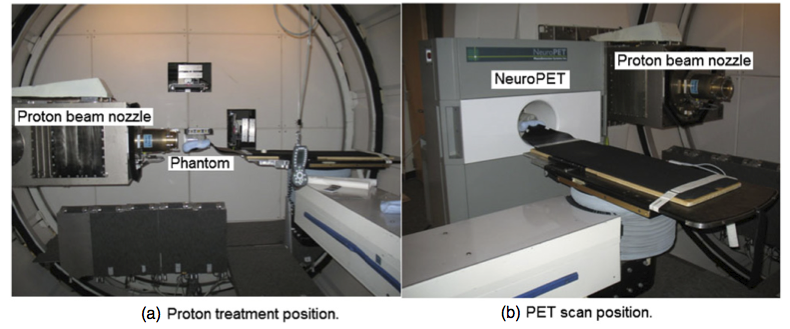
Treatment bed in the (a) proton treatment and (b) PET scan positions during an in-room phantom study. After beam delivery, the treatment bed was rotated and translated, and the phantom was inserted directly into the scanner for the PET scan.
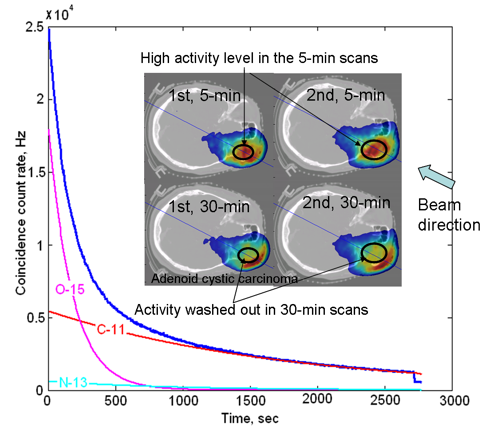
In two repeated in-room PET studies, activity washout can be clearly observed in a 30-min scan. The coincidence count rate curve shows high activity immediately after irradiation (mostly 15O) decreased quickly as a function of time.
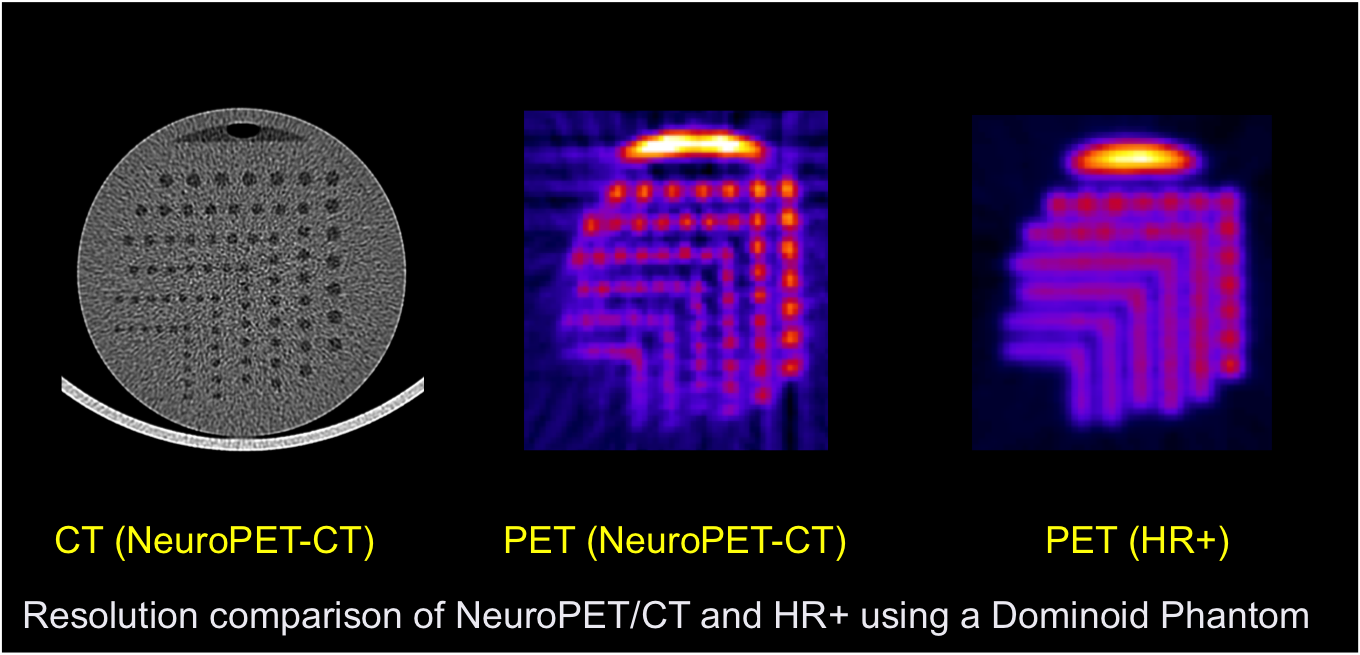
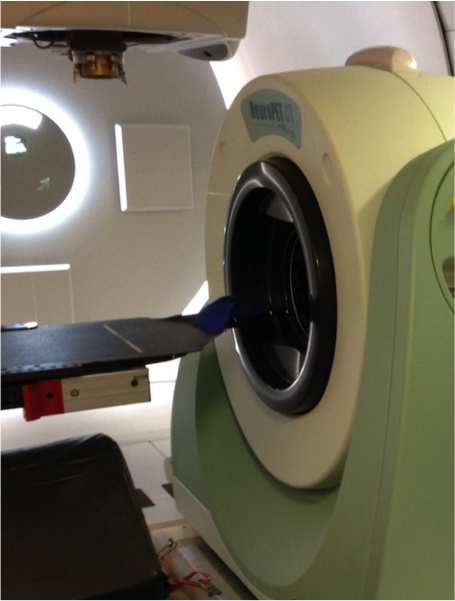
The new NeuroPET/CT scanner positioned to take data in the proton therapy room, along with CT and PET images showing the resolution:
Washout Modeling
Washout Modeling
Positron emitters produced from protons are not static. They are subject to biological processes that result in a washing out of the PET activity. Until now, empirical models have been used to estimate parameters for the “half-life” of the activity, depending on the tissue type. Because these clearance parameters do not account for individual variation, regional variation, isotope specific clearance, and the effects of tumor pathology, we are exploring a new method for estimating the washout on a patient-by-patient basis. We propose computing a three-dimensional map of the 15O-production rate directly from a set of dynamic PET measurements obtained soon after irradiation. The map of the 15O-production rate can be compared directly and quantitatively with the three-dimensional predictions of the treatment simulation for 15O. Using 15O, with a half-life of two minutes, is made possible through the use of in-room PET
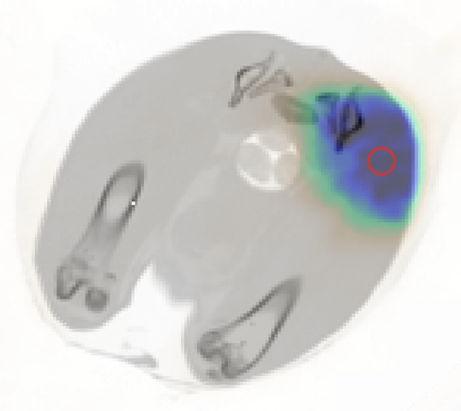
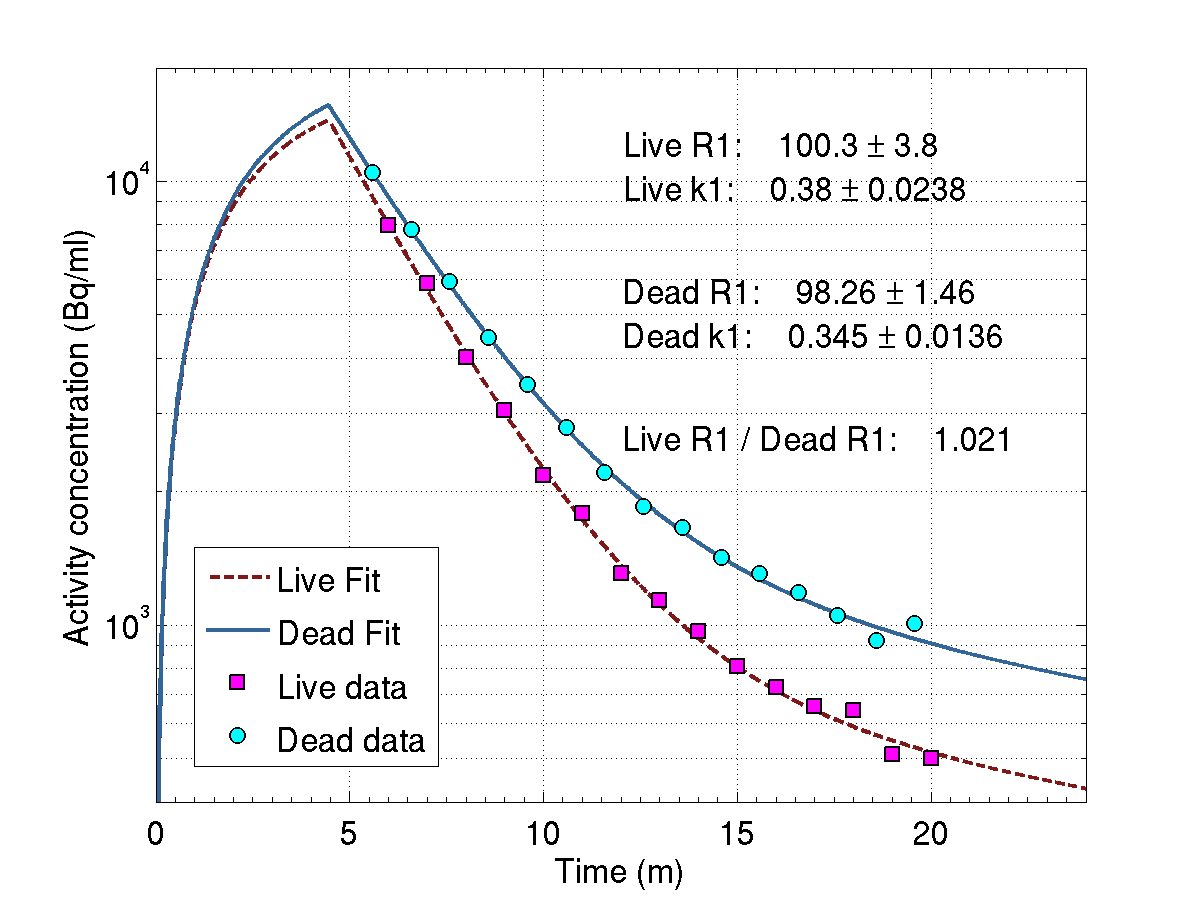
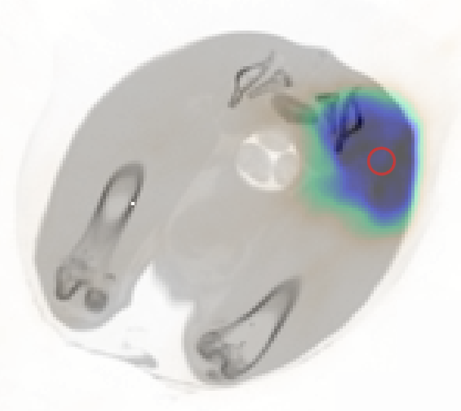
Activated regions in the rabbit thigh in live (a) and dead (b) conditions for the same irradiation parameters, overlaid on a CT image. (c) Activity concentration over time in the ROI (indicated by the red circle) for the live and dead conditions. Modeling has been applied to the activity concentration to retrieve the 15O-production rates, which agree as expected.
Monte Carlo Simulations
Monte Carlo Simulations
Below is a flow chart showing the comparison of a PET measurement of proton-induced activity to the corresponding Monte Carlo simulation. The simulations start from the treatment plan to create protons with the desired location and energy coming out of the beam nozzle. The program then simulates the passage of the protons through the patient, using the planning CT. Simulations are done with a custom version of Geant4 called TOPAS, currently in development.
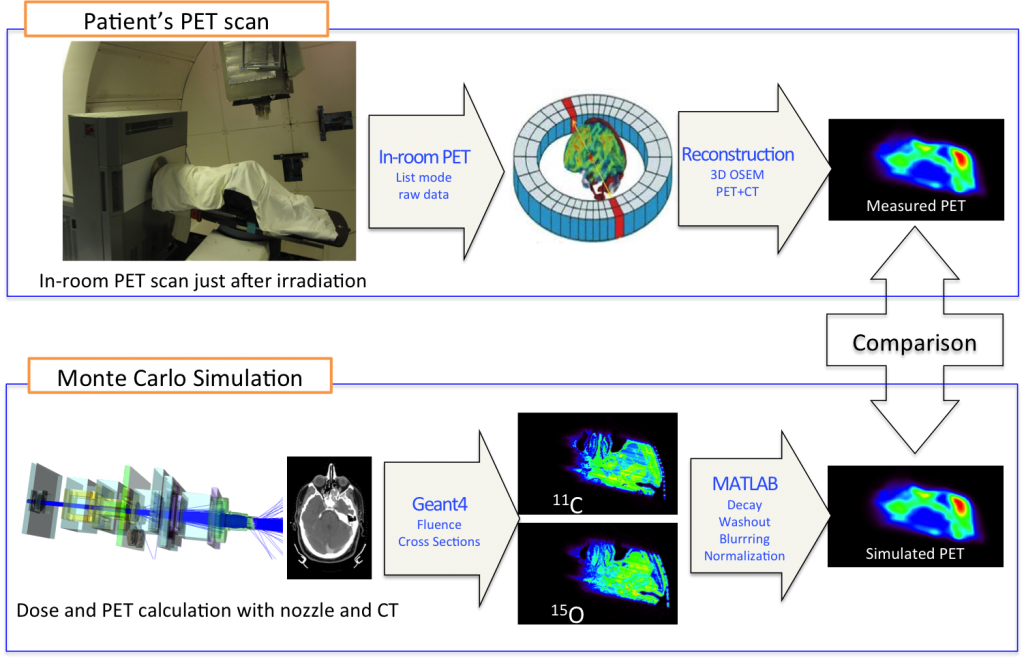
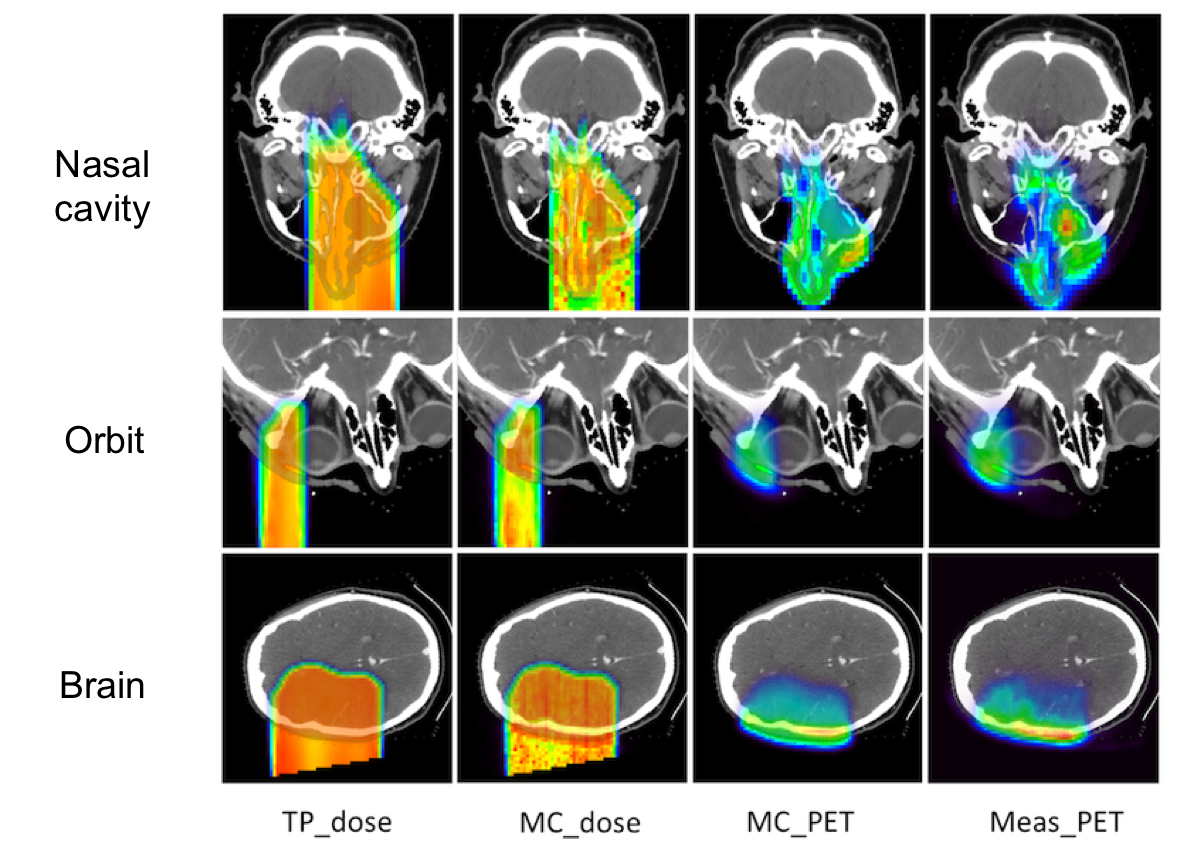
The figure below shows a comparison of the planned dose, simulated dose, simulated PET activity, and the measured PET activity for three different patients. The agreement for different types of head irradiation is quite good.
Treatment planned dose (TP_dose), simulated dose (MC_dose), simulated PET (MC_PET), and measured PET (meas_PET) for three different types of head irradiation.
Reprinted from International Journal of Radiation Oncology*Biology*Physics, 86, Chul Hee Min, Xuping Zhu, Brian A. Winey, Kira Grogg, Mauro Testa, Georges El Fakhri, Thomas R. Bortfeld, Harald Paganetti, and Helen A. Shih, Clinical Application of InRoom Positron Emission Tomography for In Vivo Treatment Monitoring in Proton Radiation Therapy, 183-189, Copyright 2013, with permission from Elsevier.
Range Assessment
Range Assessment
Proton therapy offers a highly conformal dose delivery due to the Bragg peak. However, with material-dependent depths, and large doses at the end of range, there is greater sensitivity to the uncertainty in the proton range. Inaccurate planning can lead to range uncertainties and an under-dose to the tumor or over-dose to a critical organ. Better knowledge of the extent of dose range deviations from treatment plans is needed to optimize proton therapy on an individual level. We have explored a variety of methods to accurately assess the dose range from the endogenously produced PET activity.
Although the PET signal results from nuclear interactions, while the therapeutic dose arises mainly from electromagnetic interactions, these events occur in such tight proximity that it is possible for a correlation to be found.
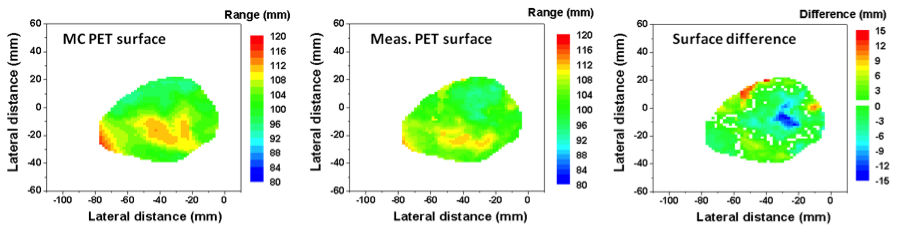
One method we have explored (lead by Chul Hee Min in Radiation Oncology) is comparing the difference in the mid-point between 25% and 50% of the maximum activity in PET vs simulated PET for line-profiles along the beam direction. This strategy was employed on patient data for the entire distal surface of the activities, producing a map of under- and overshoot.
Reprinted from International Journal of Radiation Oncology*Biology*Physics, 86, Chul Hee Min, Xuping Zhu, Brian A. Winey, Kira Grogg, Mauro Testa, Georges El Fakhri, Thomas R. Bortfeld, Harald Paganetti, and Helen A. Shih, Clinical Application of InRoom Positron Emission Tomography for In Vivo Treatment Monitoring in Proton Radiation Therapy, 183-189, Copyright 2013, with permission from Elsevier.
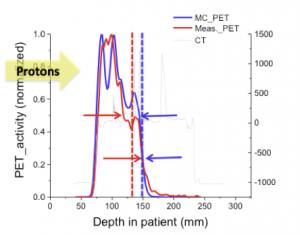
Another range comparison method we are currently investigating involves comparing the endpoints of the PET activity and planned dose directly. The main advantage of this strategy is avoiding time-consuming MC simulations.
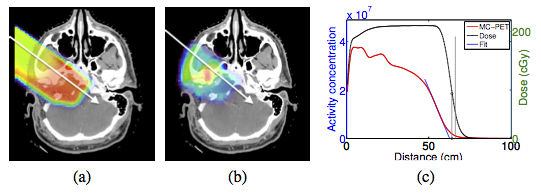
Dose (a) and MC-PET (b) distributions for patient A and profiles along the white lines (c). Endpoints for MC-PET and dose are indicated with vertical lines.
Selected Slides
Selected Slides
Related Papers
- CH Min, X Zhu, K Grogg, G El Fakhri, B Winey, H Paganetti. A Recommendation on How to Analyze In-Room PET for In Vivo Proton Range Verification Using a Distal PET Surface Method. Technol Cancer Res Treat. 2014 Sep 21. pii: 1533034614547457.[Abstract]
- Grogg K, Zhu X, Min CH, Winey B, Bortfeld T, Paganetti H, Shih HA, and El Fakhri G. Feasibility of using distal endpoints for In-room PET Range Verification of Proton Therapy. IEEE Trans. Nucl. Sci, vol. 60, no. 5, pp. 3290-3297, 2013.
[Abstract] - C.H. Min, X. Zhu, B. Winey, K. Grogg, M. Testa, G. El Fakhri, T. Bortfeld, H. Paganetti and H. Shih. Clinical Application of In-Room Positron Emission Tomography for In Vivo Treatment Monitoring in Proton Radiation Therapy. Int J Radiat Oncol Bio Phys, 2012 Feb 4. Doi: 10.1016/j.ijrobp.2012.12.010
[Abstract] - S España, X Zhu, J Daartz, G El Fakhri, T Bortfeld
and H Paganetti. Reliability of proton-nuclear interaction cross section data to
predict proton-induced PET images in proton therapy. Phys Med Biol. 2011, 56(9)
:2687-98. [Abstract] - Zhu X, España S, Daartz J, Liebsch N, Ouyang J, Paganetti H, Bortfeld TR, and El
Fakhri G. Monitoring proton radiation therapy with in-room PET imaging. Phys Med
Biol. 2011, 56(13) :4041-4057.
[Abstract] - X Zhu, TG Reese, EM Crowley and G El Fakhri. Improved MAGIC gel for higher sensitivity and elemental tissue equivalent 3D dosimetry. Med Phys 2010, 37(1):183-188. [PDF]